
Week 1 | Week 2 | Week 3 | Week 4 | Week 5
2.6
Autobahn, Oberhausen, Germany.
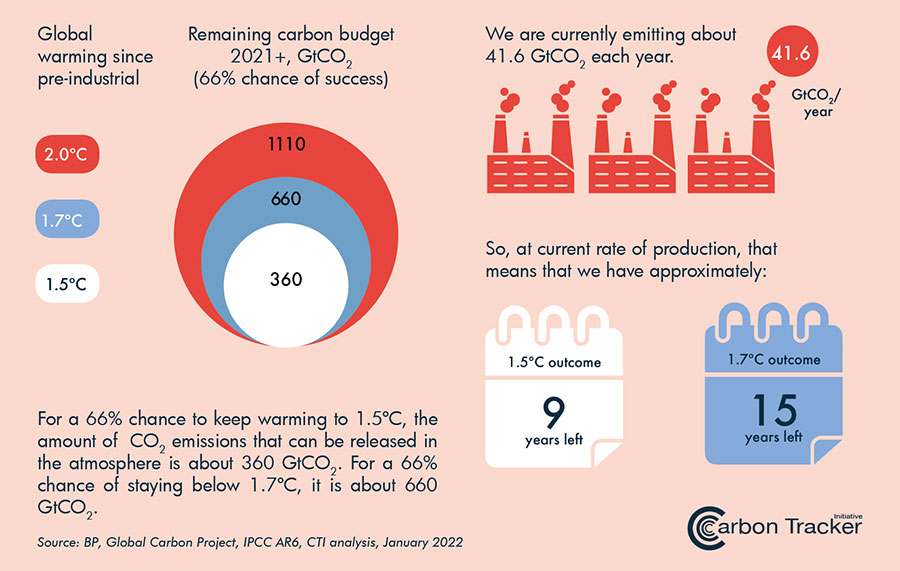
Carbon budgets: digging into the numbers
The rise in global average temperatures will predominantly be determined by the total (cumulative) emissions from the start of the industrial revolution and onwards.[1] This means that we have a set “carbon budget” of carbon dioxide emissions that can be emitted in order to have a given chance to stay within a certain temperature target.
In 2014, the IPCC estimated that in order to have a 66% chance to meet the 2°C target, the total emissions of CO2 emitted from 1870 onwards has to remain below 2900 billion tons.[2]
In 2022, the IPCC estimated that the historical cumulative net CO2 emissions from 1850 to 2019 were 2400 billion tons. Of these about 58% (or about 1400 billion tons) occurred between 1850 and 1989, and about 42% (or about 1000 billion tons) between 1990 and 2019, and notably 17% (or about 410 billion tons) of historical cumulative net CO2 emissions since 1850 occurred between 2010 and 2019.[3]
To put numbers in perspective, the current central estimate of the remaining carbon budget from 2020 onwards for limiting warming to 1.5°C with a probability of 50% has been assessed as 500 billions ton CO2 and as 1150 billion tons for a probability of 67% for limiting warming to 2°C.[4]
The longer we wait to start cutting emissions, the more rapid the rate of emissions reductions needs to be in order to stay within the budget. The Intergovernmental Panel on Climate Change (IPCC) puts it:
Any given level of warming is associated with a range of cumulative CO2 emissions, and therefore, e.g., higher emissions in earlier decades imply lower emissions later. [5]
It is also important to note that the remaining budget is significantly lower than the size of the proven fossil fuel reserves. For example, the International Energy Agency (IEA) observes that:
No more than one-third of proven reserves of fossil fuels can be consumed prior to 2050 if the world is to achieve the 2°C goal, unless carbon capture and storage (CCS) technology is widely deployed. [6]
Finally the graph below from the Climate Watch, World Resource Institute gives an overview:
This chart offers a comprehensive view of global greenhouse gas (GHG) emissions. It describes the sources and activities across the global economy that produce greenhouse gas emissions, as well as the type and volume of gases associated with each activity. [6]
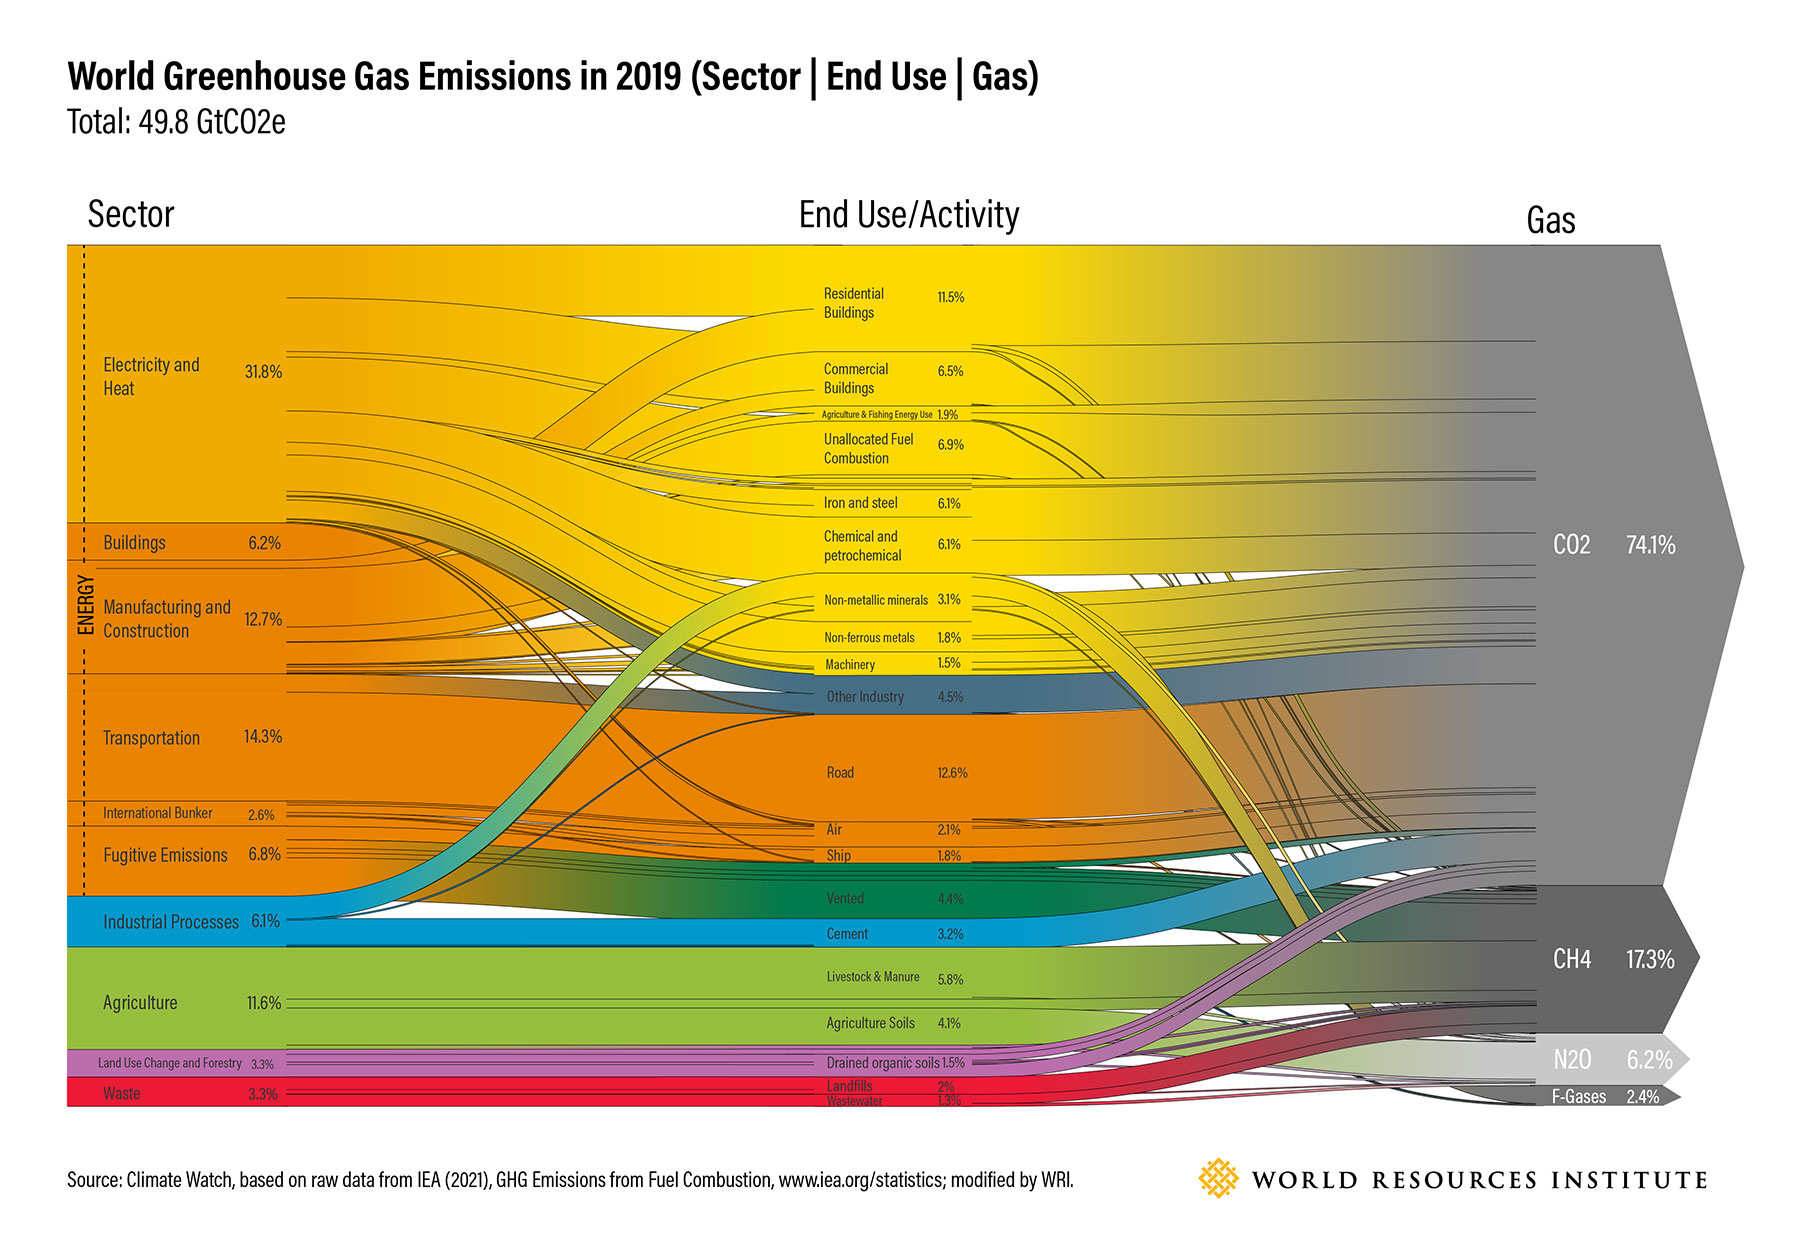
Read more here 4 Charts Explain Greenhouse Gas Emissions by Countries and Sectors.
References
- IPCC (2014). Climate Change 2014: Synthesis Report. Contribution of Working Groups I, II and III to the Fifth Assessment Report of the Intergovernmental Panel on Climate Change. Geneva: IPCC
- IPCC (2014). Climate Change 2014: Synthesis Report. Contribution of Working Groups I, II and III to the Fifth Assessment Report of the Intergovernmental Panel on Climate Change. Geneva: IPCC, p. 10
- IPCC (2022). Climate Change 2022: Mitigation of Climate Change. Summary for Policymakers.Working group III contribution ot the Sixth Assessment Report of the Intergovernmental Panel on Climate Change. Geneva: IPCC, p. 10.
- IPCC (2022). Climate Change 2022: Mitigation of Climate Change. Summary for Policymakers.Working group III contribution ot the Sixth Assessment Report of the Intergovernmental Panel on Climate Change. Geneva: IPCC, p. 10.
- Global Carbon Atlas and IPCC (2014). Climate Change 2014: Synthesis Report. Contribution of Working Groups I, II and III to the Fifth Assessment Report of the Intergovernmental Panel on Climate Change. Geneva: IPCC
- IEA (2012). World Energy Outlook 2012. Paris: International Energy Agency.
- Climate Watch (2021). World Greenhouse Gas Emissions in 2019 by Sector, End Use and Gases (static). Washington DC: World Resource Institute.
© CEMUS and Uppsala University